The Dashboard is an interface that displays the Abandoned Cart Pro plugin’s key information together in a simple and readable format.
It gives the store owner an overview of the number of abandoned orders emails captured through Popups, what the Abandoned Cart and Email Stats are, or even information about the recovered revenue!
Go to WooCommerce > Abandoned Carts > Dashboard.
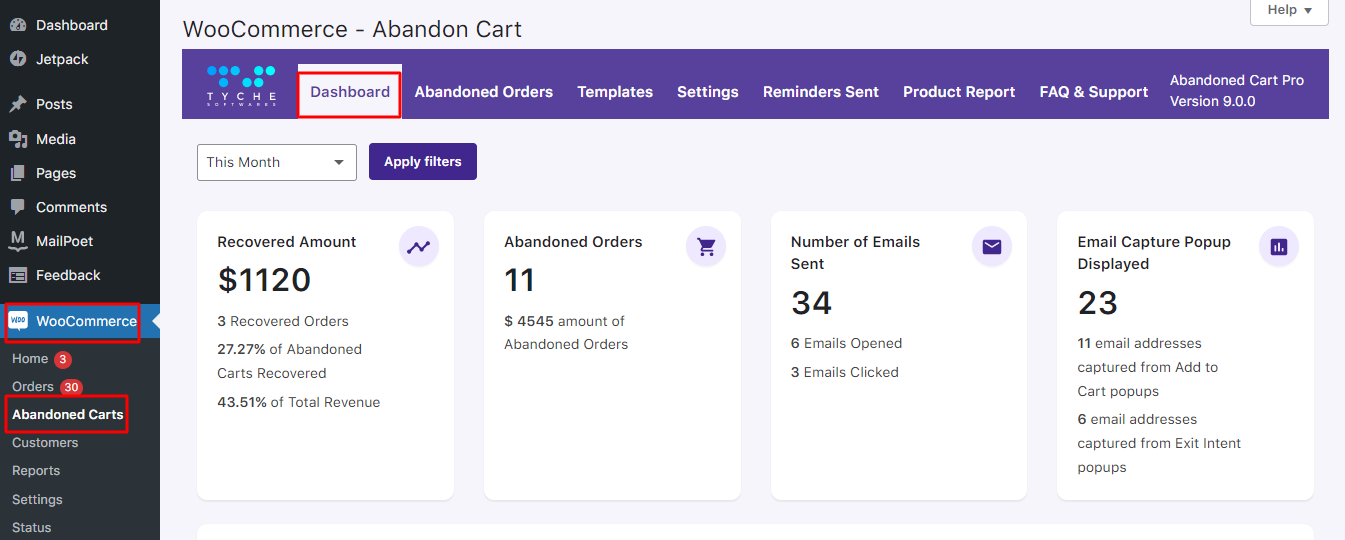
Here you will find:
5. WOOCOMMERCE- ABANDON CART GRAPH – DAY WISE
6. WOOCOMMERCE- ABANDON CART GRAPH – MONTH WISE
1. RECOVERED AMOUNT
This gives you the number of abandoned carts that were recovered. It means that the users clicked on the link provided in the abandoned cart emails and purchased the pending orders, thereby changing the abandoned carts to recovered carts.
For instance, here the image shows that 3 carts were recovered which means that 3 users clicked on the link to go to their abandoned cart and recovered i.e. complete their orders.
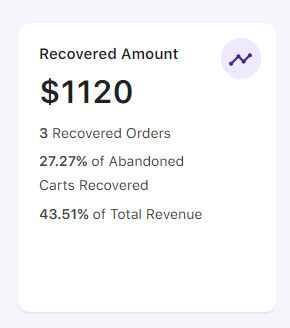
It will also some other stats such as the percentage of how many abandoned carts were recovered and the percentage of total revenue made from these recovered carts.
In this instance, since 3 orders were recovered, it made 27.27% of recovered abandoned orders thereby contributing to 43.51% of the Total Revenue.
2. ABANDONED ORDERS
Abandoned Orders are those when products are added to the cart but their purchase is not completed. These orders are identified as per the time limit set for Cart abandoned cut-off time setting is reached.
The Cart abandoned cut-off time setting is located at Abandoned Carts > Settings > General tab. The below image shows that 11 orders were abandoned.
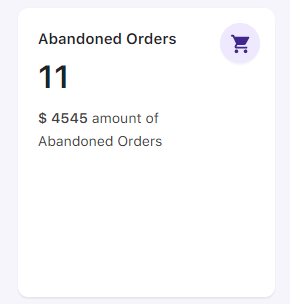
Along with this, you will see the total amount of these abandoned orders. In this case, it is $4545.
3. NUMBER OF EMAILS SENT
Once the cart is abandoned, a reminder email is sent to the registered Email address as per the email template selected under the Templates tab. Email is sent with a link that will redirect you to the cart/checkout page with the item which was abandoned.
When the cart is abandoned, the email is sent automatically only if the Enable abandoned cart emails setting under the Settings tab is enabled & the email template is Active.
When the reminder emails are sent to the customer, the dashboard shows the total number of abandoned cart reminder emails that were sent to the customers for their abandoned orders.

3. a) Open Rate
Open Rate means the total number of abandoned cart reminder emails sent versus the total number of abandoned cart reminder emails opened.
An abandoned cart reminder email will provide the details of the items in your cart like item name, price, quantity, and the link to go to the cart again to place the pending order. Reminder emails also show the coupon code if applicable to avail of a discount, etc.
Therefore, an Open Rate for the above example shows that out of the total reminder emails, 34 emails are sent and only 6 emails were opened by the users.
3. b) Click Rate
Similarly, Click Rate gives you the total number of abandoned cart reminder emails opened versus the total number of links clicked from the reminder emails. This link will redirect you to the cart/checkout page with the items you have abandoned.
The above example shows that out of the 34 emails sent, only 3 of them clicked on the link to place their order.
4. EMAIL CAPTURE POP DISPLAY
This section shows the number of popups that were displayed to the customers in order to capture their email addresses. The Abandoned Cart captures emails in two ways: through Add to Cart Popups and Exit Intent Popups.
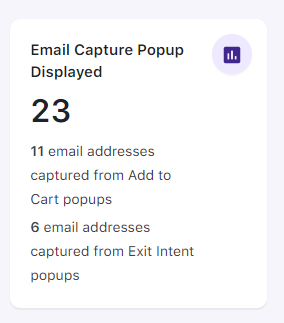
In the above image, the total number of Email capture Popups (including Add to Cart and Exit Intent) is 23.
Out of these, 11 email addresses were captured using the Add to Cart Popups.
Similarly, 6 email addresses were captured through Exit Intent Popups.
Now, in order to understand the abandoned cart stats holistically, you can view the graphs based on different time periods. Here, you can see the abandoned and recovered revenue at a glance for which dates the said revenue was high/low.
For this, use the search criteria to filter the orders and revenue datewise. You can either select the range from the dropdown list or select Custom from the dropdown to customize your search. The dropdown list will have the following options to select from This Month, Last Month, This Quater, Last Quater, This Year, Last Year, and Custom.
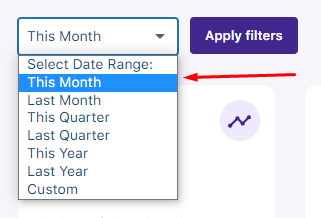
When you select any of the above options except Custom, all the respective data will be displayed. When you select Custom, you will be asked to enter the To and From date and click on Apply filters, all the details between that date range will be displayed.

For instance, you have chosen to go with This month:

You will be displayed the following two graphs:
5. WOOCOMMERCE- ABANDON CART GRAPH – DAY WISE
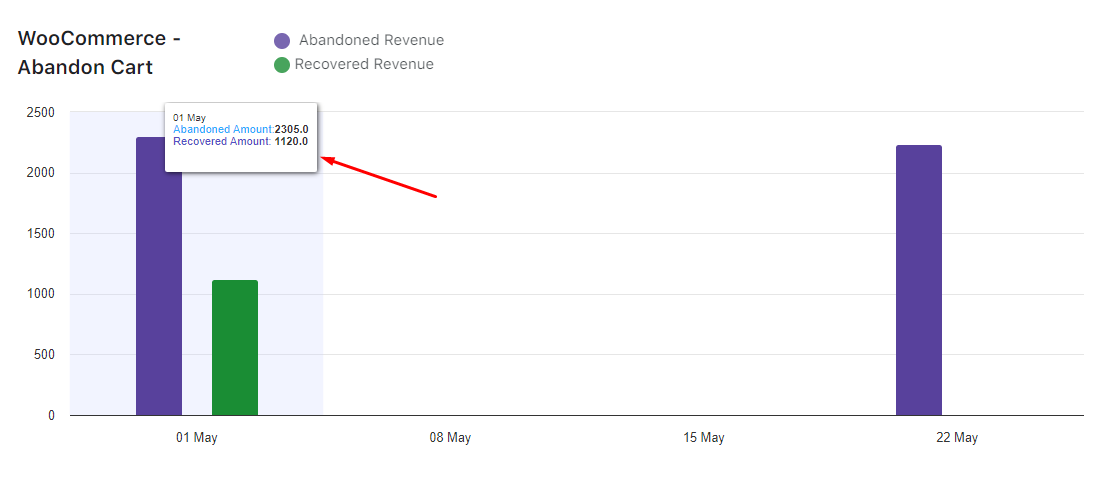
This graph will show the Abandoned Revenue and Recovered Revenue in the current month.
Abandoned Revenue refers to the amount from the abandoned carts.
Recovered Revenue refers to the amount recovered from the recovered orders.
Since it is the month of May, the graph depicts that on 1st May 2023, a total of $2305 amount was abandoned while $1120 of it was recovered.
In the days following this, there was no activity while on 22nd May 2023 you see that some amount was abandoned:
6. WOOCOMMERCE- ABANDON CART GRAPH – MONTH WISE
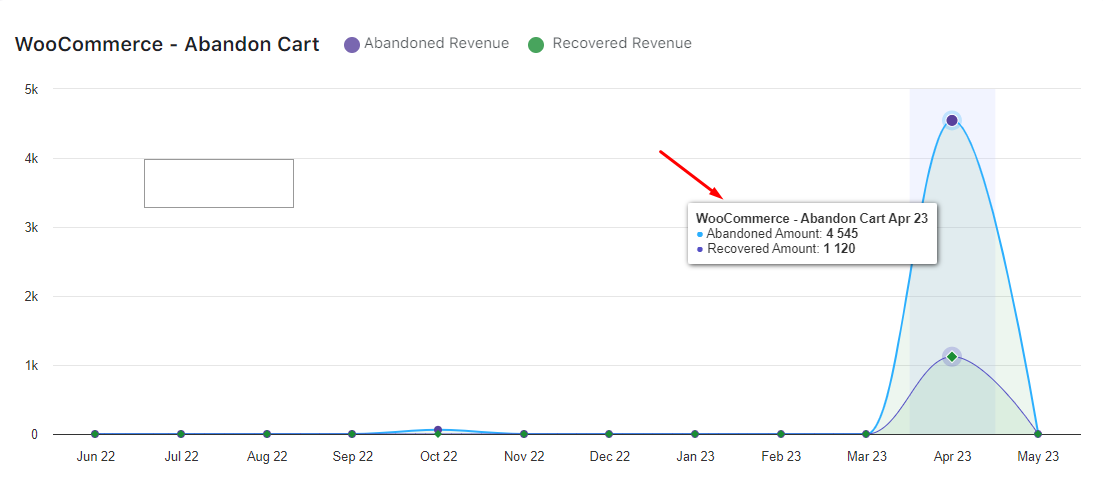
Similarly, in this graph, you will see month-wise growth or a decline in your sales as a result of abandoned orders.
In this below case, growth could be seen in the Abandoned Revenue as well as Recovered Revenue from March to April, where it peaked in April. Following this, there was a decline from April to May.
If Abandoned Revenue and Recovered Revenues are compared then the Abandoned Revenue has been more:
7. PRODUCT REPORT
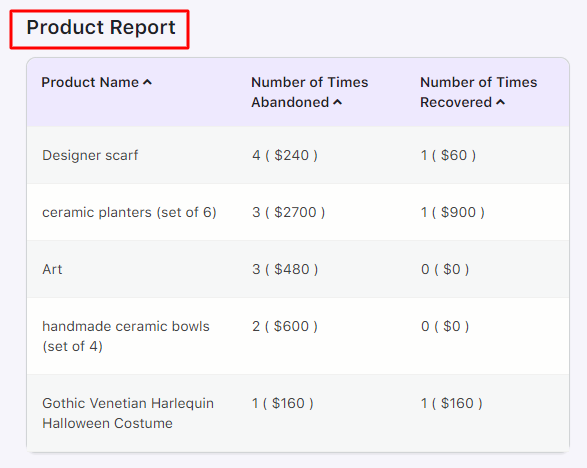
In this section, you’ll get stats about the number of times a product has been abandoned and recovered:
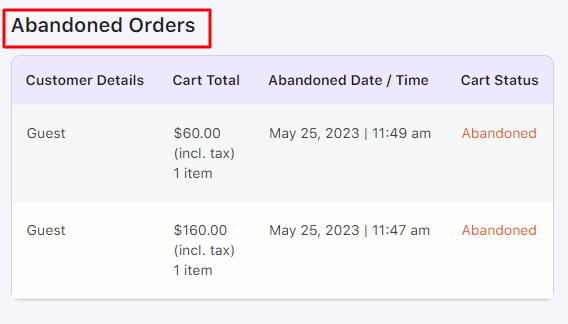
8. ABANDONED ORDERS
This section displays the details of Abandoned Orders. These details include information about the customer, their cart total, abandoned date and time, and their Cart Status:
To conclude, this is the overview of the responsive Dashboard of our Abandoned Cart Pro for WooCommerce plugin.
Please keep a note that the abandoned cart stats, email stats, and graphs will be displayed as per the selected date range.